Trading with trendlines is one of the most effective techniques in technical analysis. Whether you’re a beginner or an experienced trader, trendlines offer a powerful way to interpret market movements, identify key price levels, and predict future price movements.
In this session, we’ll break down:
- What trendlines are,
- How to draw them correctly,
- How to use them for identifying market trends, and
- Strategies for making informed trading decisions based on trendline analysis.
What are Trendlines?
Trendlines are used to visualize the direction and strength of a market’s price movements over time. They are straight lines drawn on a price chart to connect key price points, helping traders identify trends and make informed trading decisions.
Trendlines help determine whether the market is in an uptrend, downtrend, or sideways trend.
Uptrend: A line drawn connecting two or more higher lows, showing the market is moving upwards.
Downtrend: A line drawn connecting two or more lower highs, indicating a market moving downwards.
Sideways/Range-bound: Horizontal trendlines where the market moves within a flat range.
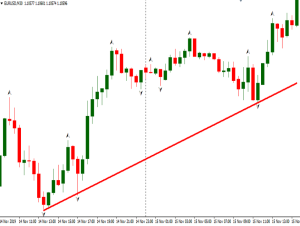
Drawing an Uptrend Trendline
An uptrend trendline is a straight line drawn upward to the right along successive reaction lows and named valid trendline.
A valid up trendline acts as support line if there is reaction of the price to make new highs.
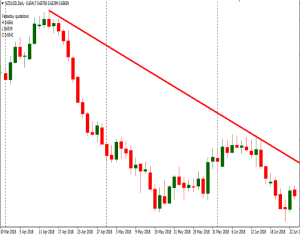
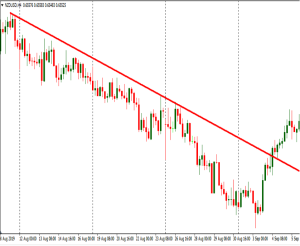
Drawing a Downtrend Trendline
A downtrend trendline is a straight line drawn downward to the right along successive reaction highs and named valid trendline.
The downtrend trendline acts as resistance level because there is reaction of the price on it and continues moving making new lows.
Confirming the Validity of a Trendline
Key Points conforming the validity:
At least two touches: A trendline needs to connect at least two price points to be considered valid.
Relevancy: The more times a trendline is touched, the stronger it becomes.
Angle: A steep trendline might be less reliable than a moderate one. A slope about 45° is more validate.
Timeframe matters: Trendlines in higher timeframes (daily, weekly) tend to be more reliable.
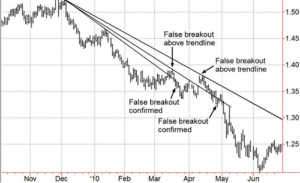
False Breakouts of Trendline
Sometimes prices will violate a trendline on an intraday basis, and close in the direction of original trend.
In this case will redrawn a new dotted line until it can be better determine which is more valid.
Don’t forget that one rule of the validity a trendline is the has a slope 45 degrees.
How to Trade Trendline Breakouts
Breakout Strategy:
A valid breakout of a trendline occurs when the price decisively moves below a previously established uptrend line or above a downtrend line, signaling a potential shift in the market trend.
When price breaks above a downtrend line, it may signal a buy opportunity.
When price breaks below an uptrend line, it may signal a sell or short opportunity.
Not all breakdowns are significant, so traders use specific criteria to confirm whether the breakdown is valid.
Confirming Breakouts:
Wait for a close above or below the trendline.
Use volume or other indicators (RSI, MACD) for confirmation.
Avoid false breakouts by waiting for retests of the trendline.
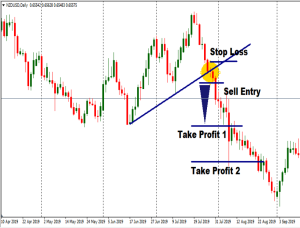
How to trade Trendline Breakouts
Sell Entry below the bottom of the next candlestick which broke the trendline.
Stop Loss above the candlestick which broke the Trendline.
Take Profit 1 the first bottom of the trendline.
Take Profit 2 the pips difference between sell entry and TP1 – 10 pips.
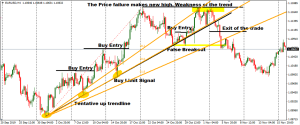
Trading Trendline Bounces
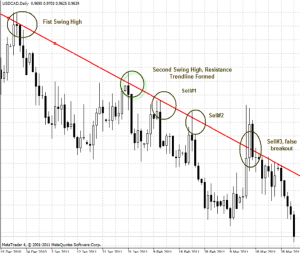
Sell near the trendline in a downtrend when price rallies to the line (resistance).
Buy near the trendline in an uptrend when price pulls back to the line (support).
In a downtrend, trading opportunities occurred every time the price is testing the trendline and continues moving downwards.
Place sell limit orders on the trendline with SL the previous high and TP at least the previous low.
Trading Trend Reversals
A downtrend trendline acts as resistance line, and will become a support line once it’s decisively breakout occurs and vice versa.
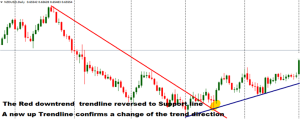
Trading Trendlines Reversals
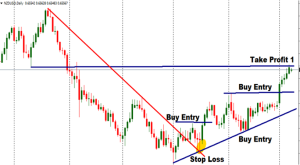
The price penetrated the red downtrend trendline retested the breakout, and the price reversed to uptrend making higher high and higher low
The new Blue Trendline identifies a trend reversal.
Buy entry signals occur when the price retest the trendline and when is moving above the previous high.
Take profit could place at the first resistance and stop loss below the support level.
Combining Trendline with moving average EMA 8
The Moving Averages confirm the validity of the trend.
In the example below the price penetrated the downtrend trendline but continued to trade sideways without clear trend reversal signal.
When the price crossed higher than the EMA 8 confirmed a trend reversal and generated a Buy signal.

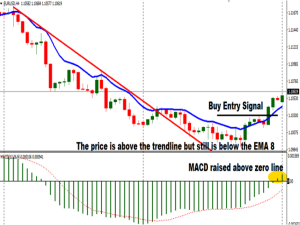
Combining Trendlines with moving average and MACD
Will combine trendline, moving average EMA 8 and MACD indicator to identify a trend reversal signal.
MACD is a trend follower indicator and confirm the momentum of a trend reversal. A strong uptrend reversal signal is when the MACD cross above its zero line.
In this example a buy signal occurred when the price breakout the downtrend trendline, crossed above the EMA 8, and MACD raised above zero line.
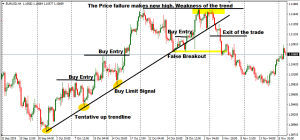
Combining Trendlines with Support and Resistance line.
How to Use the Breakout of the Trendline for Exit Point of the trades.
How to Use Fibonacci Trendlines for Potential Support and Resistance Levels
The Fibonacci trendlinesused to identify potential support and resistance levels.
In a valid downtrend trendline drawn the Fibonacci trendline connecting the first high top with the second low bottom and extended it in order to test futures prices movements.
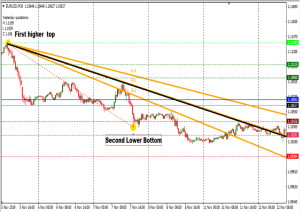
The Fibonacci Trendlines act as Potential Support and Resistance Levels
Common Mistakes to Avoid When Using Trendlines
While trendlines are powerful tool in technical analysis, many traders make mistakes than can lead to false signals. Here are some common mistakes to avoid using trendlines:
Trying to draw trendlines where they don’t naturally fit. Forcing price action to match your bias.
Relying on just two points to validate a trendline without looking for more price touches.
Using trendlines only on small timeframes (5-min, 15-min chart) and neglecting higher timeframes.
Using overly steep or flat trendlines and assume every trendline break a trading signal.
Drawing too many trendlines on a chart, which creates confusion and conflicting signals.
Ignoring market news and other fundamental events than can heavily influence the price action.
By avoiding these common mistakes. You can improve the accuracy of your trendline analysis and make more informed and accurate trading decisions.
Tips for Successful Trendline Trading
To maximize the effectiveness of trendline trading it is essential to follow best practices that help you to improve your accuracy. Here are key tips:
Before drawing trendlines, determine the overall trend analyzing long term timeframes. Trendlines on higher timeframes (4h, daily , weekly) tend to be more reliable than those on smaller timeframes.
Draw trendlines by connecting preferably three swing highs or swing lows.
Never enter a trade immediately after a trendline breakout. Wait confirmation signal such as a full candlestick close beyond and a retest of the trendline.
Trendline bounces offer excellent entry points to place a trade. Buy near the trendline in an uptrend and sell near the trendline in a downtrend.
Adjust the trendline to ensure that stay valid when new price data come in.
Combine trendlines breakout with other technical indicators to confirm a valid breakdown and trend reversal.