Daily Pivot Support and Resistance Levels
Daily Pivot Points in financial markets are critical price levels used by traders as part of technical analysis to identify potential price movements and trends. These levels help determine areas where significant price reactions—such as reversals or breakouts—are likely to occur.
Pivot points are calculated based on the previous period’s price range, typically using the high, low, and closing prices. They provide reference points for the current trading session.
Traders frequently utilize daily or weekly pivot points, which are derived from the previous day’s or week’s high, low, and close (HLC) prices. These levels help traders identify support and resistance levels, which can guide them in making buy or sell decisions for the current period.
Calculating Pivot Levels
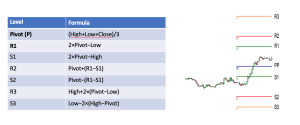
Formula for Pivot Point (P) based on the High, Low and Close price of the previous day to determine the Pivot Point level for the next day.
Pivot Point = (High + Low + Close ) of the previous day /3
Support (S1, S2, S3) and Resistance (R1, R2, R3) levels are calculated using the pivot point.
R1, R2, R3: Resistance levels above the pivot point.
S1, S2, S3: Support levels below the pivot point.
What is the difference between Pivot Points and Major Support and Resistance levels
The Pivot Point (PP) and its associated support and resistance levels are derived from the previous period’s high, low, and close prices. These levels are used to identify potential price targets for the upcoming trading period.
Major Support and Resistance levels represent key areas on the price chart where the market has reacted previously.
Support is a price level or area on the chart where, during a downtrend buying pressure is strong enough to overcome selling pressure.
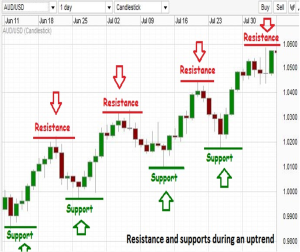
Resistance is a price level or areas on the chart where in an uptrend the selling interest becomes strong enough to overcome buying pressure.
Resistence in an uptrend
Resistance is the highest price level of a specific candlestick that stands above both the two preceding and two subsequent candlesticks.
When multiple peaks occur at roughly the same price level, this forms a resistance area.
In an uptrend, resistance is established when selling pressure becomes strong enough to halt the rising price, preventing the market from making new highs. This indicates that the upward momentum has weakened, and sellers are overpowering buyers at that price level.
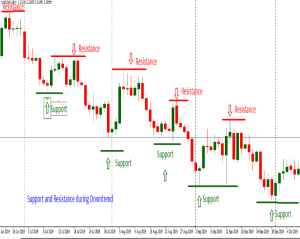
Support in a downtrend
Support is the lowest price level of a particular candlestick that is below both the two preceding and two subsequent candlesticks.
When multiple troughs occur at a similar price level, this creates a support area.
In a downtrend, support is formed when buying pressure becomes strong enough to halt the declining price, preventing the market from making new lows. This indicates that the downward momentum has weakened, and buyers are overpowering sellers at that price level.
Identifying Support and Resistance on the chart analyzing bigger timeframes
Analyzing bigger timeframes like daily, and weekly, is easier to identify strong support and resistance levels.
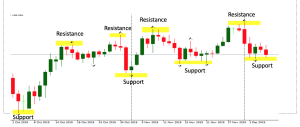
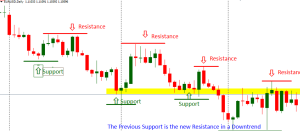
The previous Support will reverse to a new Resistance in a downtrend and vice versa.
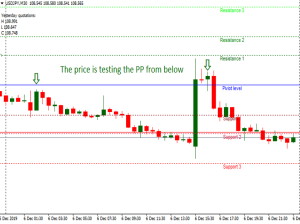
Price action in a downtrend market based on a daily pivot points analysis
In a downtrend after day’s close, the price typically trades below the Pivot Point and often makes a small correction to test it.
If the downtrend remains intact, the price is likely to continue moving downward, testing Support 1(S1) or Support 2 (S2).
After a consolidation between S1 and S2, the price may continue its downtrend movement to test Support 3 (S3).
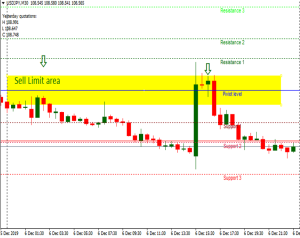
Trading Signals with Entry levels using daily pivot points analysis
In a downtrend the price is trading between the Pivot Point(PP) and the Support 1(S1).
Sell Limit orders will be places with a 10-pips range the Pivot Point.
Stop Loss is set 5 pips above Resistance 1 (R1).
Take profit targets are set at Support levels S1, S2 and S3.
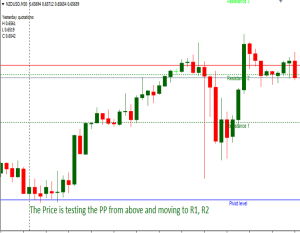
Price action in an uptrend market based on a daily pivot points analysis
In an uptrend after the day’s close, the price typically trades above the Pivot Point and often makes a small correction to test it.
After that if the uptrend is valid the price will continues moving upwards to test the Resistance 1 or Resistance 2 .
After a consolidation between R1 and R2 is possible to continue moving upwards to test R3.
Entry levels based on an uptrend market using daily pivot points analysis
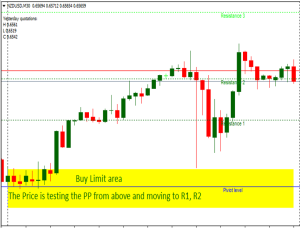
In an uptrend the price is trading between the Pivot Point (PP) and the Resistance 1 (R1).
Buy Limit orders will be placed in a range 10-pip range around the Pivot Point.
Stop Loss is set 5 pips below Support 1 (S1).
Take profit targets are set at Resistance Levels R1, R2 and R3.
Trading Strategy in a range market using pivot points analysis
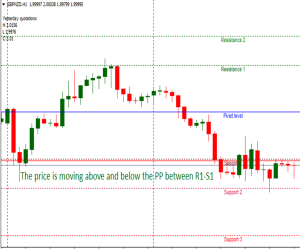
In a sideways range movement the price often is trading above and below the Pivot Point testing the Resistance 1 (R1) and Support 1 (S1).
The price likely is moving in a few pips range movement around the Pivot Point.
Entry levels based on a range market using daily pivot points analysis
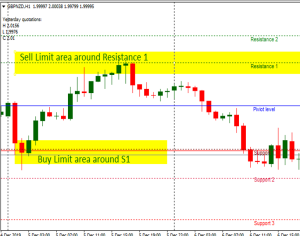
In a sideways price movement around the Pivot Point, will be placed Limit Orders on the Support 1 and Resistance 1.
Buy limit orders will be placed within a 10-pip range around the Support 1 (S1).
Sell limit orders will be placed within a 10-pip range around the Resistance 1 (R1).
Stop Loss is set 5 pips above Resistance 2 or below the Support 2.
Take profit targets are set at Resistance 1 for Buy Limit orders and at Support 1 for Sell Limit orders.
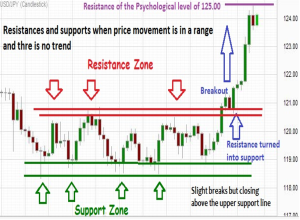
How to trade Breakouts of a rangebound area
If the price is moving Sideways in a range movement occurs great opportunities to trade the Breakout.
Buy Stop orders 5 pips above the Resistance Zone with SL 5 pips below the Support Zone and TP the previous higher Resistance.
Sell Stop orders 5 pips below the Support Zone with SL 5 pips above the Support Zone and TP the previous lower Support.
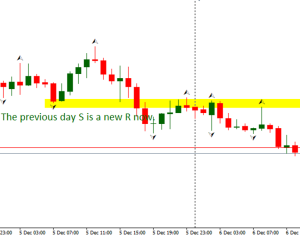
Trading Strategy using major Support (S) and Resistance (R) Levels
After a significant bearish movement, the price forms a new bottom and Support level (S).
In this scenario, the previous day’s Support now acts as the new Resistance (R) level.
The price is possible to test the new Resistance (R) level.
Placing a Sell Limit Order near the new R area, would be a good entry point, with SL 5 pips above the R and TP the new S level and also 20 pips below it.
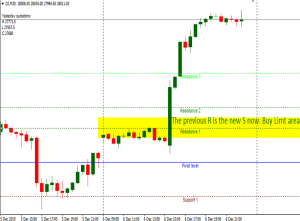
Entry levels following a big Bullish Movement using major Support (S) and Resistance(R)
After a big Bullish Movement the price makes new high R point and is trading above the high of the previous day.
In this case the previous day’s R will be now the new S level.
It is possible the price to make a correction testing the new S .
A Buy Limit Order in the new S area will be a good entry level with SL 5 pips below the S and TP the new R and also 20 pips above it.
Key points for using Pivot Points Strategies:
1. Identify Market Sentiment with Pivot Points. Price above PP indicates a bullish sentiment and the price is more likely to continue rising. Price below PP indicates bearish sentiment and the price is more likely to fall.
2. Trend confirmation with Pivot Points. The price is likely to stay above the Pivot Point in an uptrend or below it in a downtrend. If the price fails to break through resistance or Support levels, a reversal may be likely.
3. Pivot Points are often used by day traders to identify potential reversal or breakout points during the day. Weekly or monthly Pivot Points give a bigger picture for swing trading or long-term trend following.
4. In a sideways market, prices often oscillate between S1 and R1, allowing traders to buy at Support and sell at Resistance level.
5. Combine Pivot Points with other indicators like RSI (Relative Strength Index) or MACD to confirm the entry points and improve the success rate of the Pivot Points based strategies.
6. Set clear Risk/Reward ratios ensuring the potential reward is greater than the risk. If you set a Buy limit order around the PP or S1, the potential TP should be greater than the SL.