Candlestick patterns are one of the most popular and powerful tools used in technical analysis for trading and investing. Developed by Japanese rice traders in the 18th century, candlesticks visually represent price movements over a specific time period and provide a clear picture of market sentiment.
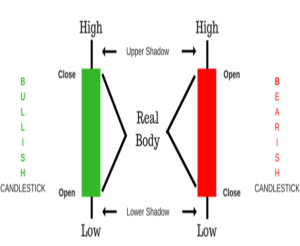
Each candlestick displays four key pieces of information: the opening price, closing price, the highest price, and the lowest price of a given period. The distinctive shape of candlesticks, with their “body” (the range between the open and close) and “wicks” or “shadows” (the highs and lows), helps traders quickly identify patterns that signal potential future price movements.
These patterns can indicate market reversals, continuations, or indecision, making them essential tools for anticipating future trends and making informed trading decisions.
Anatomy of the Candlestick
The wide part of the candlestick is called the “real body“.
A white or green body means that the close price was higher than the opening price.
The black or red body means that the close price was lower than the opening price.
The small lines above and below the body are referred as wicks or shadows.
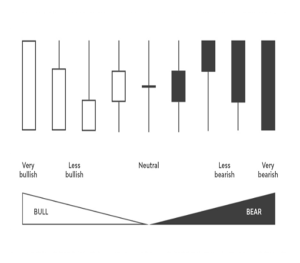
Neutral Bullish and Bearish Candlestick Patterns
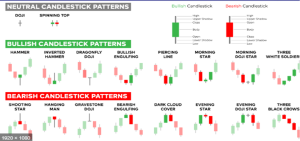
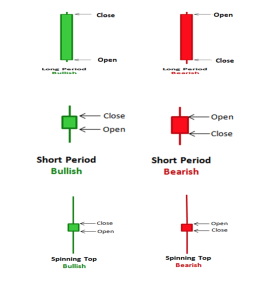
Single Candlestick Patterns
Long Days are called the candlesticks with big difference between the opening and the closing price.
Short Days are called the candlesticks with small difference between the opening and the closing price.
Spinning Tops are candlesticks with very small bodies and greater than the body upper and lower shadows.
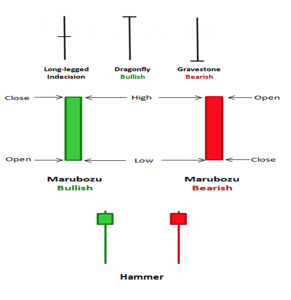
Doji lines are called candlesticks when the open and the close price are equal and can have shadows of varying length.
Marubozu type of candlestick has no wicks at either ends of the candlestick, representing a strong buying or selling pressure.
Hammer candlestick has a long lower wick that is about two or three times long as the real body, and with little or no upper wick. The real body is at the upper end of the candle’s trading range. A hammer only occurs in a downtrend.
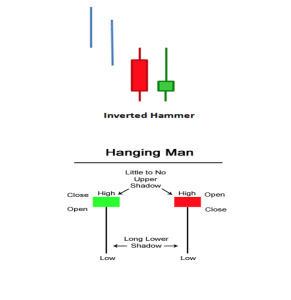
Inverted hammer occurs at the bottom of a downtrend and can indicate a trend reversal. Is has a long upper wick that is about two or three times long as its real body, with little or no lower wick. The inverted hammer candle must be a bull candle, and proceeded by a bear candle.
Hanging man has a long lower wick that is about two or three times long as its real body, with no or little upper wick. Although the candle can either bullish or bearish, a bearish candle adds more weight to its interpretation. The hammer and hanging man are visually identical, but have absolutely opposite meanings depending on the price action that preceded it.
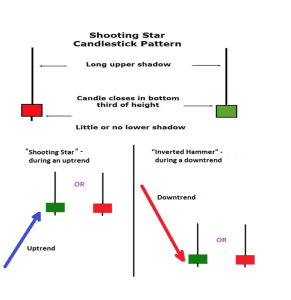
Shooting Star Candlestick
Shooting star looks identical to an inverted hammer but occurs during an uptrend.
This pattern is a bearish reversal signal, with a long upper wick that is two to three times long as its body and may have either a very short or no lower wick.
The candle can be either bullish or bearish, but a bearish candle has more weight on the upcoming reversal.
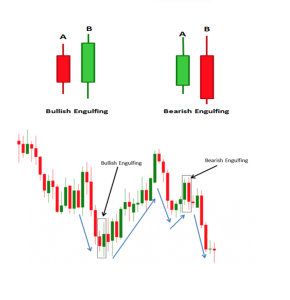
Engulfing candlestick pattern
Engulfing candle pattern forms when candlestick’s real body completely engulfs the preceding candlestick’s body.
The pattern consists of two candlesticks (A and B candles) that signal a trend reversal.
A bullish engulfing patternis a bullish reversal signal. It forms when a bearish candle (A) is succeeded and engulfed by a larger bullish candle (B).
A bearish engulfing patternis a bearish reversal signal that forms when a bullish candle (A) is succeeded and engulfed by a larger bearish candle (B)
Inside Bar Candlestick Pattern
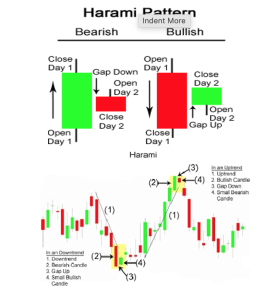
Harami or Inside bar, is the opposite of the engulfing pattern.
It is a trend reversal pattern that consist of two candlesticks (A and B candles), with the body of candle B completely inside the body of candle A.
A bullish haramioccurs in a downtrend and may signal a trend reversal.
A bearish haramioccurs in an uptrend and a bearish trend reversal.
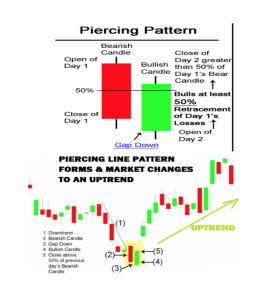
A piercing pattern is a bullish reversal signal that occurs in an established downtrend.
It consist of two candles (A and B), where A is a bearish candle, and B is a bullish candle.
The open price of candle B may be equal or below candle A’s close price.
The close price of candle B must be equal or above the midpoint of candle A’s body (candle B pierces the midpoint of candle A), but not above the open price of candle A.
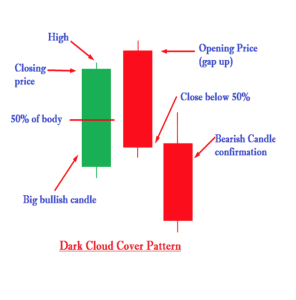
Dark Cloud Cover Pattern
The dark cloud cover is a bearish reversal pattern that forms in an established uptrend.
It consists of two candles (A & B), where candle A is a bullish candle and candle B is a bearish candle.
The open price of candle B may be equal or above candle A’s close price.
The close price of candle B must be equal or below the midpoint of candle A’s body (candle B pierces the midpoint of candle A), but not below the open price of candle A.
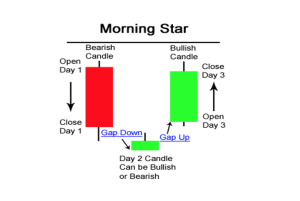
Morning and Evening Star Patterns
Morning star are three –candle pattern that usually ends a trend. It is a trend reversal signal pattern, depending on the price action around it.
A morning star is a bullish reversal pattern that happens during a downtrend.
Candle A must be a bearish bar during an established downtrend
Candle B can be a bearish or bullish. It must have a short body (or a doji), indicating an indecision in the market.
The third candle must be a bullish candle. It must close at the midpoint or above the midpoint of candle A’s body to confirm that a trend reversal is in play.
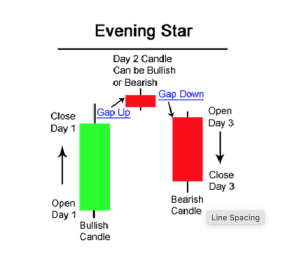
Evening Star
An evening staris the opposite of a morning star. It is a bearish reversal pattern that occurs during an uptrend.
Candle A must be a bullish bar during an established uptrend
Candle B can be a bearish or bullish. It must have a short body (or a doji), indicating an indecision in the market.
The third candle must be a bearish candle. It must close at the midpoint or below the midpoint of candle A’s body to confirm that a trend reversal is in play.
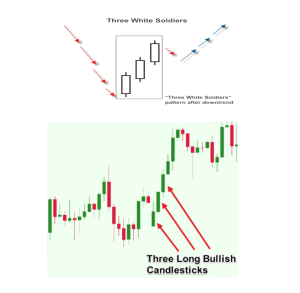
Three White Soldiers Pattern
These pattern consists from three candlesticks with consecutively higher closes and close near or at the higher price.
It is a bullish pattern that indicates a reversal when it occurs during a downtrend.
It is a continuation of an uptrend if it occurs during an uptrend.
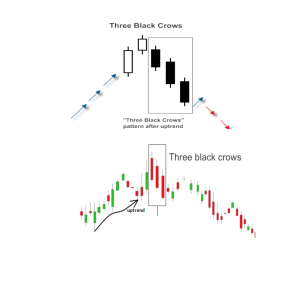
Three Black Crows Pattern
Three long black candlesticks have consecutively lower closes that close near or at their low prices.
This is a bearish sign that indicates a reversal when it occurs an uptrend .
It is a continuation of a decline if it occurs in a downtrend.
Candlestick strength ratio – bulls vs. bears
To understand the price and candlestick analysis, it helps if you imagine the price movements in financial markets as a battle between the buyers and the sellers.
Buyers speculate that prices will increase and drive the price up through their trades and/or their buying interest.
Sellers bet on falling prices and push the price down with their selling interest.