Defining Market Volatility
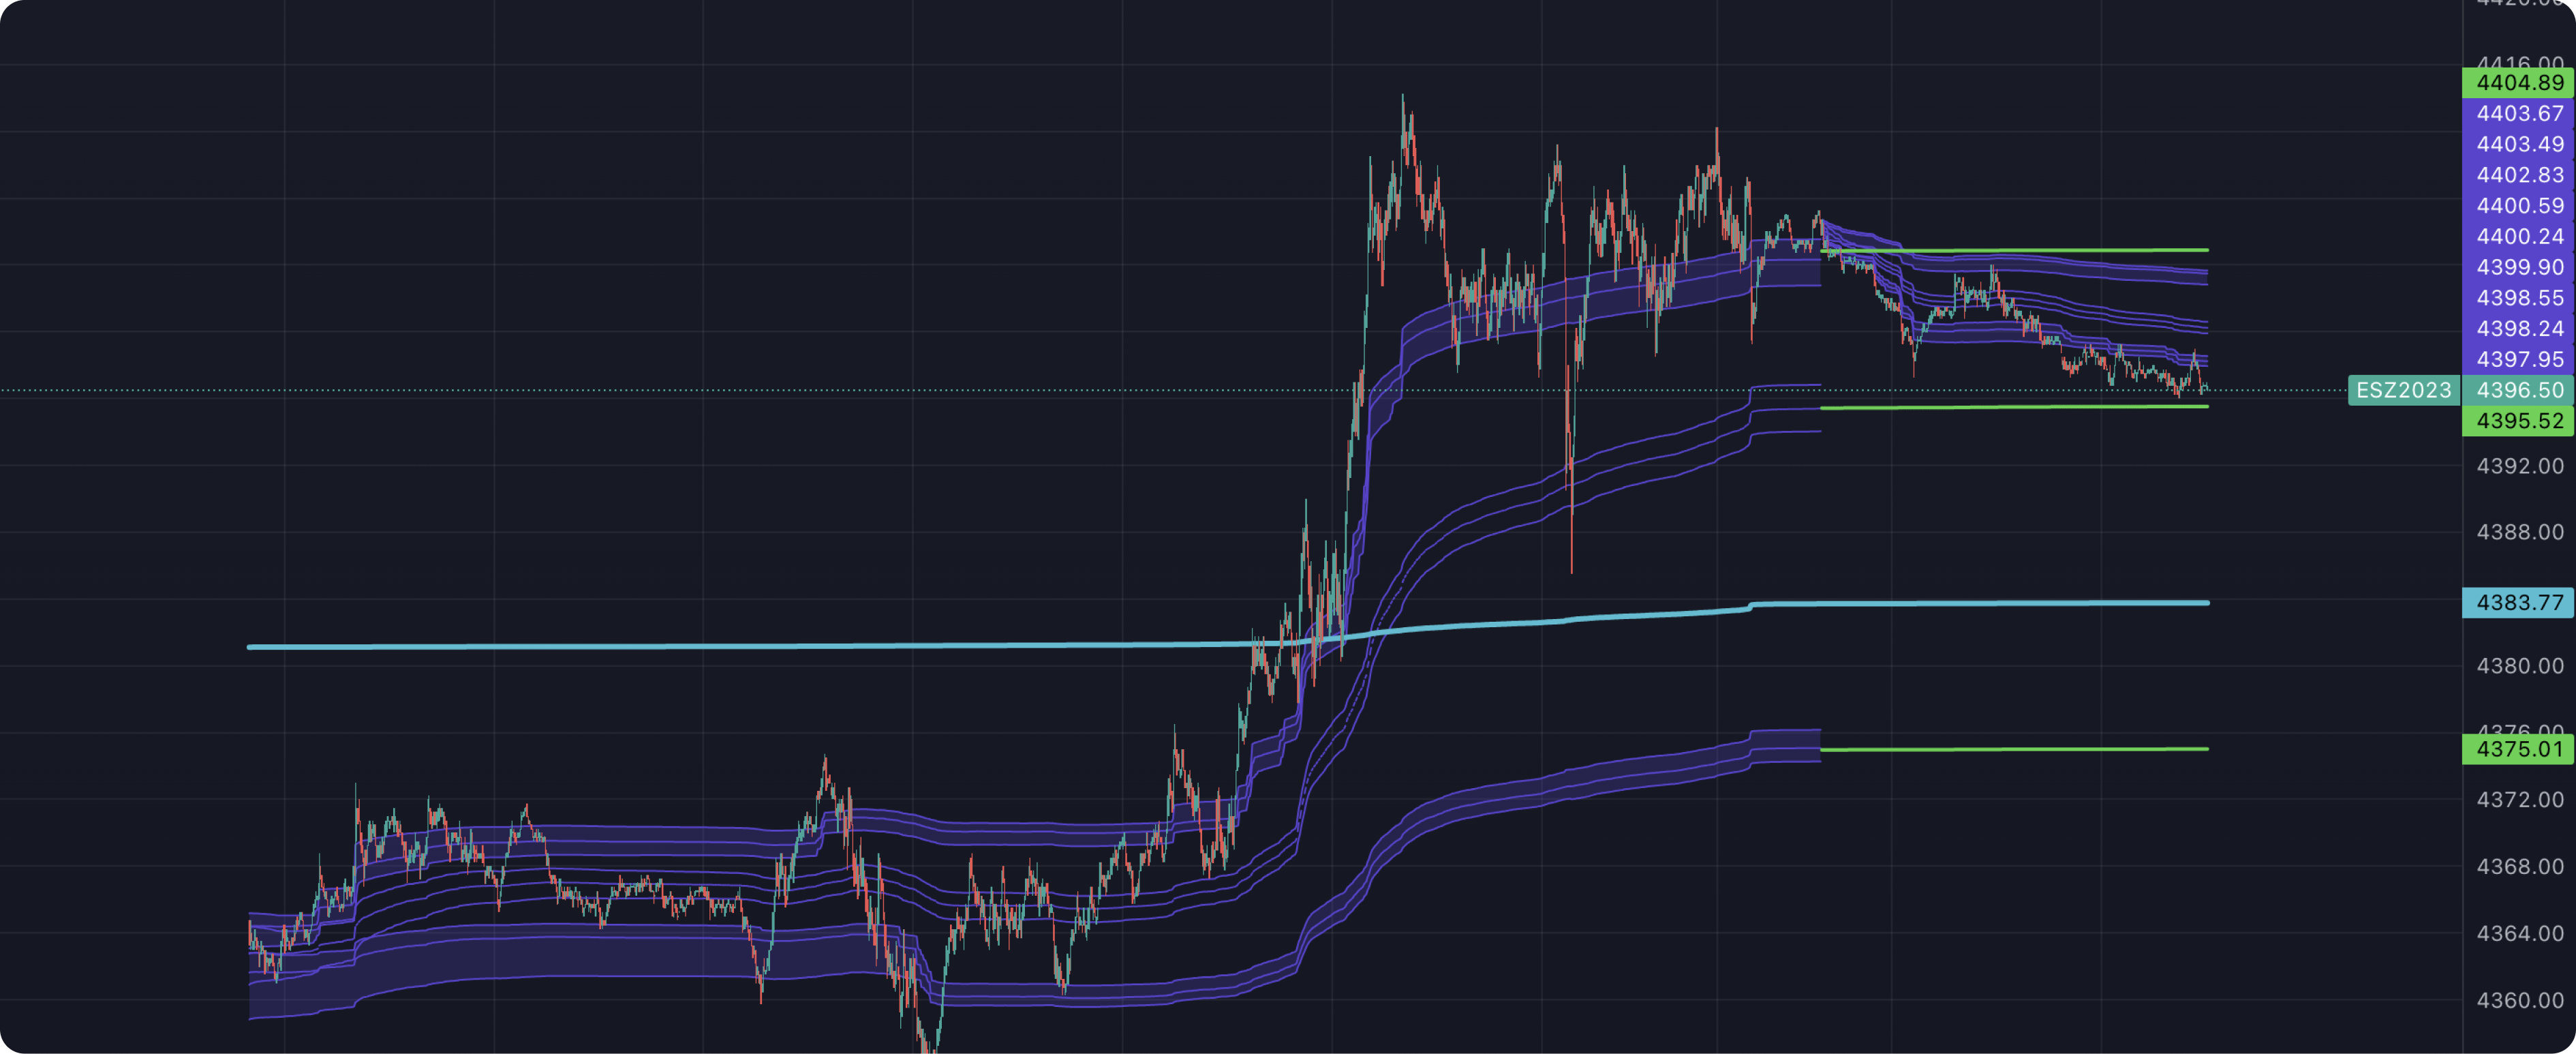
What sets EdgeZones apart is its unique feature of plotting the 50% average between the VWAP and corresponding extremes.

EdgeZone is based on 3 concepts
EdgeZone Strategy Overview
Because of these conflicting mindsets, these zones are thought to display areas of balance between buyers and sellers, which can serve as potential decision points throughout the day.
Example while in an uptrend
BUYERS
Buyers may see price falling to the Hi 50% as an attractive value entry for the continuation upwards.
SELLERS
Sellers may see price falling to the Hi 50% as a change in sentiment with more downwards movement on the way.
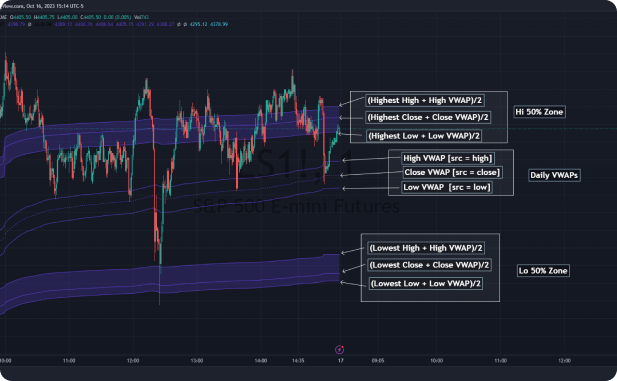
Daily Insights
Technically speaking, an average between vwap and extreme is a single point, to make these into zones I am using multiple sources for vwap and tracking different points of the bar throughout the day (ex. Close VWAP & Daily Highest Close).
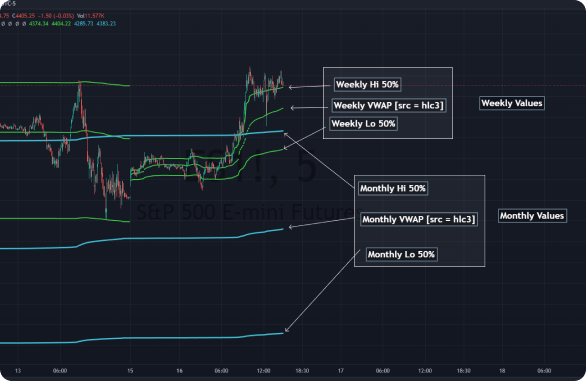
Weekly/Monthly Insights
These hold up as important levels for speculation; however, since most action will be discovered at the daily zones, I am not displaying the zones for the Weekly and Monthly to keep noise to a minimum.


